About me
Hello! I'm Sergio. Science, particularly acoustics, is my passion, and I keep
photography, videography and science communication as hobbies.
I'm an acoustic engineer with a PhD in Hearing Sciences. Most of my work sits at the
intersection of acoustics, signal processing and AI for hearing technology. I have a
background in Acoustic Engineering (UFSM-BR), a Master's in Mechanical Engineering
(UFSC-BR), and a Ph.D. in Hearing Sciences (Nottingham-UK).
I'm Senior Audiology Systems Engineer at Oticon (Demant) in Copenhagen. I have been
connected to the group since 2018, starting with a PhD industrial secondment at Eriksholm
Research Centre (Oticon's research arm), and joined as a full-time employee in 2021.
Today I work on closed-loop audiological systems, lab acoustic measurements and Simulink
modelling for parameter optimisation, and Generative AI inside engineering workflows.
Outside the day job I keep a research interest in spatial audio and auralization. I'm
the author of the Iceberg method, developed during my PhD inside the HEAR-Eco MSCA project.
The MATLAB version is open-source at github.com/aguirreSL/Iceberg.
Professional Experience
JUNE 2022 - NOW
Oticon (Demant) Audiology and Software
Kongebakken 9, DK-2765 Smørum, Denmark
Position: Senior Audiology Systems Engineer
Promoted to Senior in January 2025.
Description: I work on audiological algorithm development and
verification, with a focus on Feedback Management and adjacent systems. Activities
include lab acoustic measurements and Simulink modelling for parameter optimisation
across audiological algorithms (including closed-loop and AI-driven blocks),
verification methods for complex acoustic scenes, and Generative AI inside engineering
workflows.
Past contributions include co-developing room-independent measurement methods for
Microphone Location Effect and pressure-related compensations (now used as internal
verification standards), improving the stimulus design for feedback-path measurement,
and contributing to the architectural evolution of Feedback Management.
JUNE 2021 - JUNE 2022
Oticon Medical - Denmark
Bone-Anchored Hearing System
BAHS Audiology and Software
Kongebakken 9, DK-2765 Smørum, Denmark
Position: Audiology and Signal Processing Engineer
Description: Audiological signal processing for bone-anchored hearing
technology, inside a team fully dedicated to bone-anchored solutions. Activities included
implementation and verification of audiology algorithms for next-generation bone-anchored
devices, designing and automating test protocols for audio quality and audiology
validation (improving turnaround across release cycles without compromising sound
quality), and developing proofs of concept and internal tools that supported product
development decisions on building materials and release readiness. Cross-functional
contributor to the launches of the Ponto 5 Super Power (2022) and Sentio devices,
launched in 2024.
JULY 2018 - JUNE 2021
University of Nottingham, School of Medicine
Glasgow, United Kingdom
With industrial secondment at Eriksholm Research Centre (part of Oticon),
Oct 2018 - Dec 2020
Position: Early Stage Researcher (MSCA Industrial PhD, HEAR-Eco
project)
Description: I designed and validated realistic communication scenarios
that mimic real-life listening situations, used to study the impact of hearing aids on
listening effort through physiological measures. A significant part of the work focused
on simplifying the loudspeaker setup needed to control the localization error in sound
virtualization, which led to the Iceberg auralization method, a hybrid VBAP and
first-order Ambisonics technique for room auralization with a small number of
loudspeakers, intended for auditory research.
During the Eriksholm secondment I worked on the development and implementation of sound
virtualization systems, ran acoustical measurements, equipment calibration and
simulations, and designed and led experiments on the behaviour of hearing aids inside
virtualized sound fields.
JANUARY 2016 - JANUARY 2018
Federal University of Santa Catarina
Department of Mechanical Engineering
Laboratory of Acoustics and Vibration
Trindade, Florianópolis, Santa Catarina - Brazil
Position: Graduate Student Researcher (MSc, IMPCoclear project)
Description: I investigated whether virtual audio techniques could
improve sound source localization for cochlear-implant users. I implemented and evaluated
a sound source virtualization system based on Vector Based Amplitude Panning (VBAP), and
designed and ran the listening tests to assess where the technique helped and where it
did not.
APRIL 2011 - DECEMBER 2015
Federal University of Santa Maria
Department of Structures and Construction (DECC) - Brazil
Position: Undergraduate Research Assistant (Acoustic Engineering
BSc)
Description: Five years of undergraduate research in acoustics, signal
processing and vibrations within the Acoustics & Vibrations Research Group (GPAV).
My BSc thesis was a 3D loudspeaker directivity measurement system, including
characterisation of low-cost microphones against a B&K reference for calibration.
Beyond the thesis, I worked on didactic electrical circuits for Digital Signal
Processing, contributed to acoustic prototypes for bioacoustic exams, performed room
acoustic measurements and simulations, and supported acoustic design projects
(insulation and treatment). I also produced and edited noise-awareness audio spots for
science communication.
Research Interests
Bone Anchored
Bone-anchored hearing systems are surgically implanted prosthetic devices that treat hearing loss. The sound vibrations are captured, processed, and sent through the skin, bypassing the ear parts that aren't working.
Spatial Hearing Research
Study of the spatial aspects of hearing impairment, the behavior of normal and disabled listeners and improvements that the devices can bring to mitigate related problems. In particular, the study of realistic communication scenarios through spatial audio reproduction systems. The aim is to create the necessary conditions to investigate benefit provided by hearing devices, for example, reducing daily auditory effort.
AI for Hearing Technology
The new generation of hearing aids increasingly relies on machine learning to adapt to the listener's acoustic context. AI-driven blocks coexist with classical signal processing and need to deliver consistent perceptual quality across very different acoustic scenes, all within the tight power and latency constraints of a hearing device. The challenge is to combine this with rigorous algorithm verification, so that the benefits of data-driven approaches translate into real-world listening situations.
Generative AI in Engineering Workflows
Large Language Models and agentic systems are becoming part of how engineering work is done. Beyond writing code, they help with knowledge retrieval, instruction-following workflows, and structured documentation when given the right context. The interest here is in how to integrate these tools responsibly into engineering pipelines: which problems they actually solve, how to verify their outputs, and what guardrails are needed to keep them dependable inside a regulated environment like medical device development.

Science Communication
In a world that is increasingly globalized, connected and with more readily accessible technologies, a considerable portion of the population still has no interest in science, technology and the functioning of their devices and programs. This may be in part because people do not understand communication provided by the academic-scientific world. Scientific communication is the practice of informing, educating, sharing wonders and raising awareness about topics related to science. Among so many genres on YouTube, scientific communication presents new ways to connect with a larger audience and in less orthodox ways. The world has evolved thanks to science and scientific communication is changing.
Room Acoustics
Room Acoustics is the study of physical acoustics that aims to model and describe the propagation of sound energy in a closed or semi-closed space. Sound waves are affected due to the geometric composition and the physical properties of the materials. That creates an identity for each space, thus affecting the quality of a sound, be it speech, music or any type of noise.
Spatial Audio
Various spatial audio techniques, with different complexities, qualities and paradigms, allow virtualization of both individual sound sources and sound fields. Through the process called auralization, files can be created that can be reproduced and perceived as spatialized audio.
Contact info
Iceberg Auralization Method
Iceberg: A loudspeaker-based room auralization method for auditory research
Sergio Luiz Aguirre - PhD Thesis, 2023
Abstract
Depending on the acoustic scenario, people with hearing loss are challenged on a different scale than independent of normal hearing people to comprehend sound, especially speech. That happens especially during social interactions within a group, which often occurs in environments with low signal-to-noise ratios. This communication disruption can create a barrier for people to acquire and develop communication skills as a child or to interact with society as an adult. Hearing loss compensation aims to provide an opportunity to restore the auditory part of socialization.
Technology and academic efforts progressed to a better understanding of the human hearing system. Through constant efforts to present new algorithms, miniaturization, and new materials, constantly-improving hardware with high-end software is being developed with new features and solutions to broad and specific auditory challenges. The effort to deliver innovative solutions to the complex phenomena of hearing loss encompasses tests, verifications, and validation in various forms. As the newer devices achieve their purpose, the tests need to increase the sensitivity, requiring conditions that effectively assess their improvements.
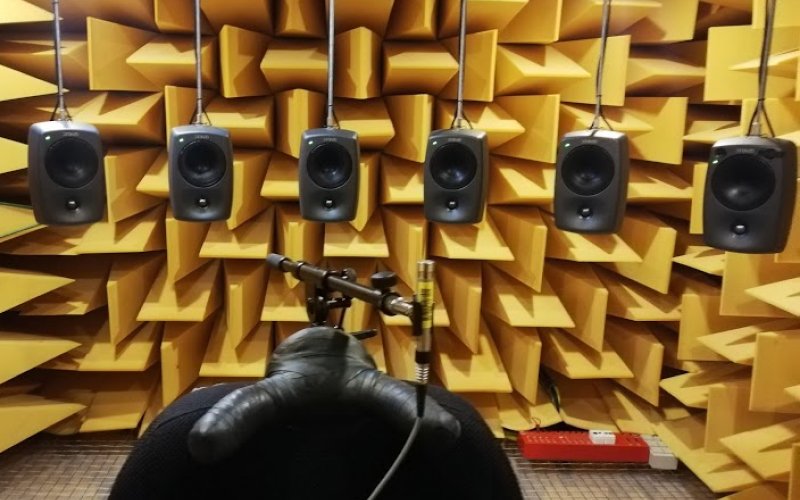
Regarding realism, many levels are required in hearing research, from pure tone assessment in small soundproof booths to hundreds of loudspeakers combined with visual stimuli through projectors or head-mounted displays, light, and movement control. Hearing aids research commonly relies on loudspeaker setups to reproduce sound sources. In addition, auditory research can use well-known auralization techniques to generate sound signals. These signals can be encoded to carry more than sound pressure level information, adding spatial information about the environment where that sound event happened or was simulated.
This work reviews physical acoustics, virtualization, and auralization concepts and their uses in listening effort research. This knowledge, combined with the experiments executed during the studies, aimed to provide a hybrid auralization method to be virtualized in four-loudspeaker setups. Auralization methods are techniques used to encode spatial information into sounds. The main methods were discussed and derived, observing their spatial sound characteristics and trade-offs to be used in auditory tests with one or two participants. Two well-known auralization techniques (Ambisonics and Vector-Based Amplitude Panning) were selected and compared through a calibrated virtualization setup regarding spatial distortions in the binaural cues. The choice of techniques was based on the need for loudspeakers, although a small number of them. Furthermore, the spatial cues were examined by adding a second listener to the virtualized sound field. The outcome reinforced the literature around spatial localization and these techniques driving Ambisonics to be less spatially accurate but with greater immersion than Vector-Based Amplitude Panning.
A combination study to observe changes in listening effort due to different signal-to-noise ratios and reverberation in a virtualized setup was defined. This experiment aimed to produce the correct sound field via a virtualized setup and assess listening effort via subjective impression with a questionnaire, an objective physiological outcome from EEG, and behavioral performance on word recognition. Nine levels of degradation were imposed on speech signals over speech maskers separated in the virtualized space through Ambisonics’ first-order technique in a setup with 24 loudspeakers. A high correlation between participants’ performance and their responses on the questionnaire was observed. The results showed that the increased virtualized reverberation time negatively impacts speech intelligibility and listening effort.
A new hybrid auralization method was proposed merging the investigated techniques that presented complementary spatial sound features. The method was derived through room acoustics concepts and a specific objective parameter derived from the room impulse response called Center Time. The verification around the binaural cues was driven with three different rooms (simulated). As the validation with test subjects was not possible due to the COVID-19 pandemic situation, a psychoacoustic model was implemented to estimate the spatial accuracy of the method within a four-loudspeaker setup. Also, an investigation ran the same verification, and the model estimation was performed with the introduction of hearing aids. The results showed that it is possible to consider the hybrid method with four loudspeakers for audiological tests while considering some limitations. The setup can provide binaural cues to a maximum ambiguity angle of 30 degrees in the horizontal plane for a centered listener.
Introduction
Individuals with normal hearing often can effortlessly comprehend complex listening scenarios involving multiple sound sources, background noise, and echoes. However, those with hearing loss may find these situations particularly challenging. These environments are commonly encountered in daily life, particularly during social events. They can negatively impact the communication abilities of individuals with hearing loss. The difficulties associated with understanding complex listening scenarios can be a significant barrier for individuals with hearing loss, leading to reduced participation in social activities.
Several hearing research laboratories worldwide are developing systems to realistically simulate challenging scenarios through virtualization to better understand and help with these everyday challenges. The virtualization of sound sources is a powerful tool for auditory research capable of achieving a high level of detail, but current methods use expensive, expansive technology. In this work, a new auralization method has been developed to achieve sound spatialization with a reduction in the technological hardware requirement, making virtualization at the clinic level possible.
Key Chapters
Chapter 2: Literature Review
Examines previous work in virtualization and auralization, basic concepts of human sound perception, room acoustics, and loudspeaker-based virtualization.
Chapter 3: Investigation of Binaural Cue Distortions
Compares VBAP and Ambisonics methods through a calibrated virtualization setup in terms of spatial distortions and examines spatial cues with a second listener.
Chapter 4: Behavioral Study
Examines subjective effort within virtualized sound scenarios (first-order Ambisonics), focusing on how signal-to-noise ratio (SNR) and reverberation affect listening effort in speech-in-noise tasks.
Chapter 5: The Iceberg Method
Proposes a hybrid auralization method combining VBAP and Ambisonics for small reproduction systems (four loudspeakers), evaluated with objective parameters and hearing aids.
Conclusion
Throughout the course of this study, a new auralization method called Iceberg was conceptualized and compared to well-known methods, including VBAP and first-order Ambisonics, using objective parameters. The Iceberg method is innovative in that it uses "Center Time" (TS) to find the transition point between early and late reflections in order to split the Ambisonics impulse responses and adequately distribute them. VBAP is responsible for localization cues in this proposed method, while Ambisonics contributes to the sense of immersion.
In the center position, the Iceberg method was found to be in line with the localization accuracy of other methods while also adding to the sense of immersion. Also, a second listener added to the side did not present undesired effects to the auralization. Additionally, it was found that virtualization of sound sources with Ambisonics can implicate limitations on a participant’s behavior due to its sweet spot in a listening-in-noise test. However, these limitations can be circumvented and extended to Iceberg, resulting in subjective responses that align with behavioral performance in speech intelligibility tests and increasing the localization accuracy.
Cite this work
Repository: repository.nottingham.ac.uk/handle/123456789/58572
@phdthesis{aguirre2023iceberg,
  author = {Aguirre, Sergio Luiz},
  title  = {Iceberg: a loudspeaker-based room auralization method for auditory research},
  school = {University of Nottingham, School of Medicine},
  type   = {PhD thesis},
  year   = {2023},
  url    = {https://repository.nottingham.ac.uk/handle/123456789/58572},
  note   = {Supervisors: William M. Whitmer, Graham Naylor, Lars Bramsl{\o}w}
}Loading thesis text...